

Three tools that measure AI's impact on the job market
The debate about AI’s impact on the job market has been going on for years, but it only recently moved past the “experts predict” stage. Tools have appeared that try to actually measure this impact and make it publicly available. I looked at three of them, and each approaches the topic from a completely different angle.
1. JobLoss.ai, a tracker of AI-linked layoffs
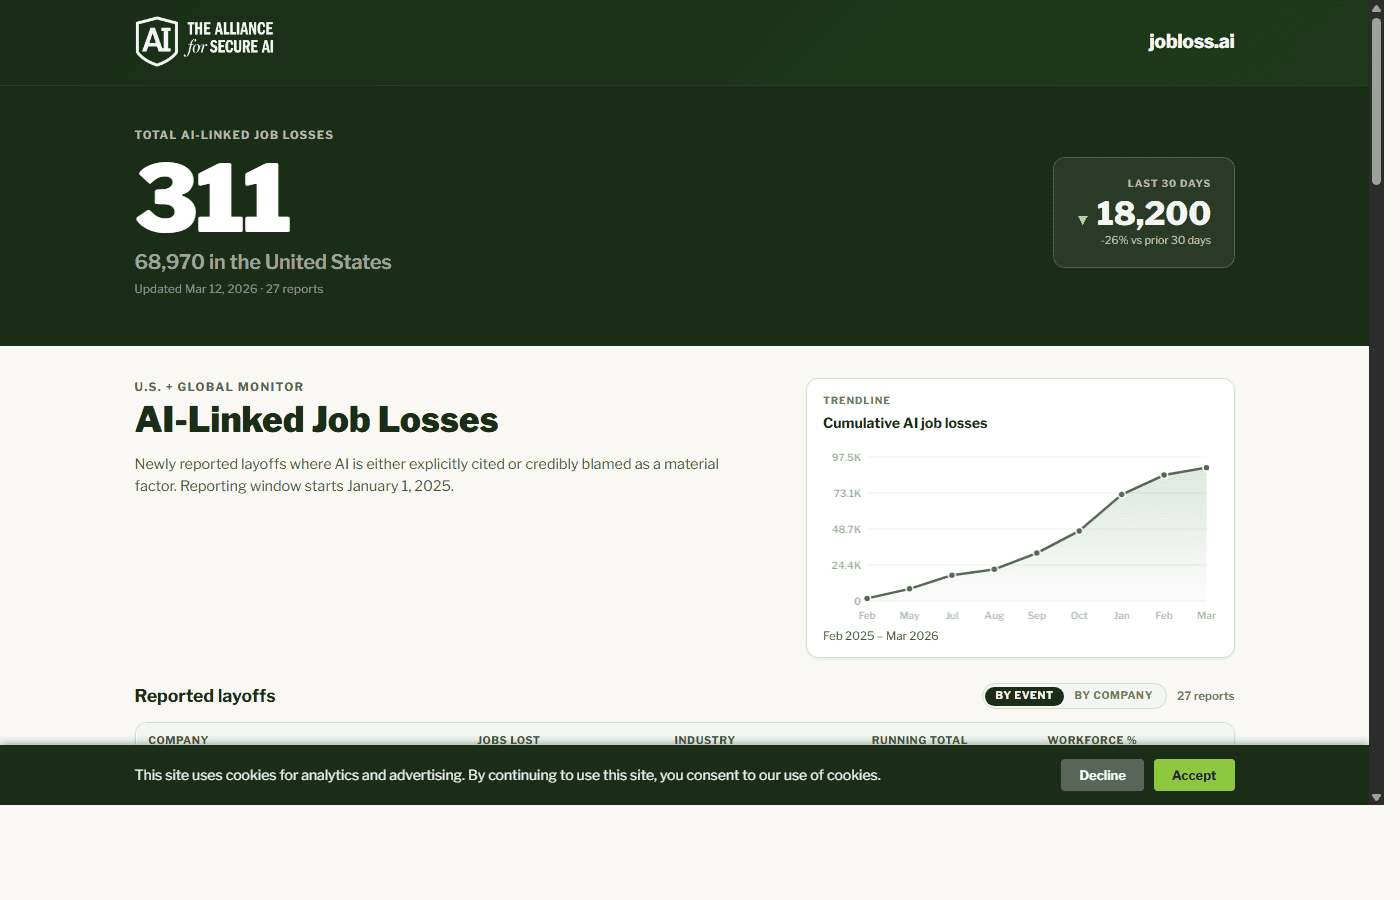
JobLoss.ai is a project by The Alliance for Secure AI. It monitors mass layoffs where artificial intelligence has been identified as a material factor. Data has been collected since January 1, 2025, based on reports from AP, Reuters, CNBC and other major outlets.
At the top of the dashboard there’s an animated counter showing the total number of jobs lost in connection with AI. At the time of writing, it’s over 68,000 in the United States alone, which honestly surprised me. That’s a lot for just over a year of data collection. Next to it, the number of layoffs from the last 30 days is displayed along with a trend relative to the previous month.
Each report is classified according to one of three attribution types:
- EXPLICIT — the company directly cited AI or automation in an official statement,
- BLAMED — credible media identified AI as the primary driver,
- MIXED — AI was mentioned alongside other restructuring factors.
An interactive chart shows cumulative job losses over time. You can browse the data by individual events or aggregated per company, and each entry includes the percentage impact on the company’s workforce.
There’s also a contact form for people who lost their jobs due to AI deployment at their employer. I think that’s a smart addition, because official company statements are one thing, while the perspective of laid-off workers is a completely different story.
2. Karpathy Jobs, an interactive map of the US job market
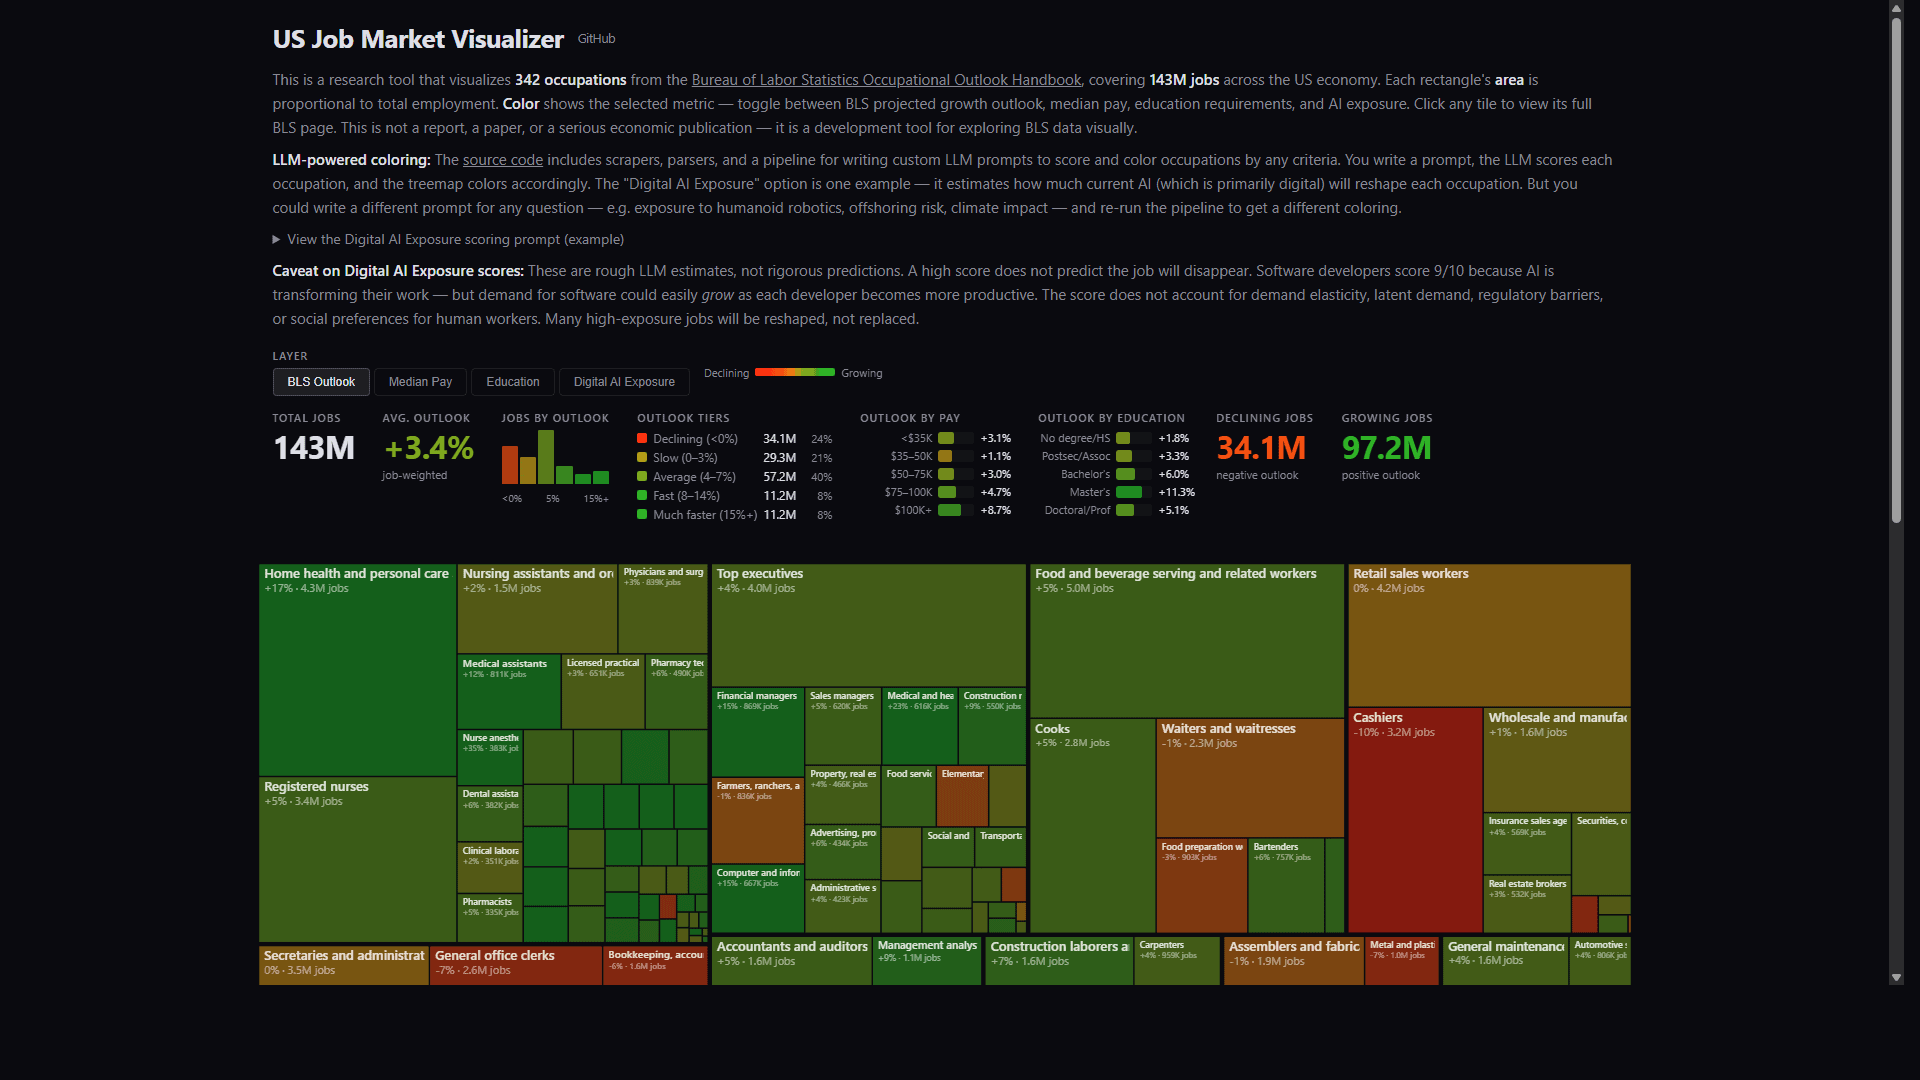
Andrej Karpathy, co-founder of OpenAI and former head of AI at Tesla, published a tool on GitHub called US Job Market Visualizer. It’s an interactive treemap covering 342 occupations from the Bureau of Labor Statistics, which together represent about 143 million jobs in the US economy.
The size of each rectangle corresponds to the number of people employed in a given occupation, and the colors can be switched between four layers:
- BLS Growth Outlook — official employment projections (green means growth, red means decline),
- Median Pay — median salary (from $25K to over $250K),
- Education — required education level (from no formal requirements to doctoral degree),
- Digital AI Exposure — a custom 0-10 scale estimating how much AI could reshape a given occupation.
That last layer is by far the most interesting one. The “AI Exposure” score was created by running each occupation’s BLS description through the Claude model, which rated the degree of exposure to change. Karpathy himself stresses that these are not predictions of job elimination. They don’t account for demand elasticity, regulatory barriers, or social preferences for human workers. But they give you a sense of which occupations AI could change the most, and I find that worth exploring even with all the caveats.
Hovering over any tile reveals details: occupation name, median salary, number of jobs, required education, and a description justifying the score. A side panel shows histograms and cross-tabulation charts.
The interactive version is available at karpathy.ai/jobs, and the entire pipeline (scraping, parsing, LLM scoring, visualization) is open-source on GitHub.
3. Layoffs.fyi, a tech sector layoff database
Layoffs.fyi is the longest-running of the three tools. Roger Lee, a startup founder, has been running this tracker since March 2020 and documents mass layoffs at tech companies and startups worldwide.
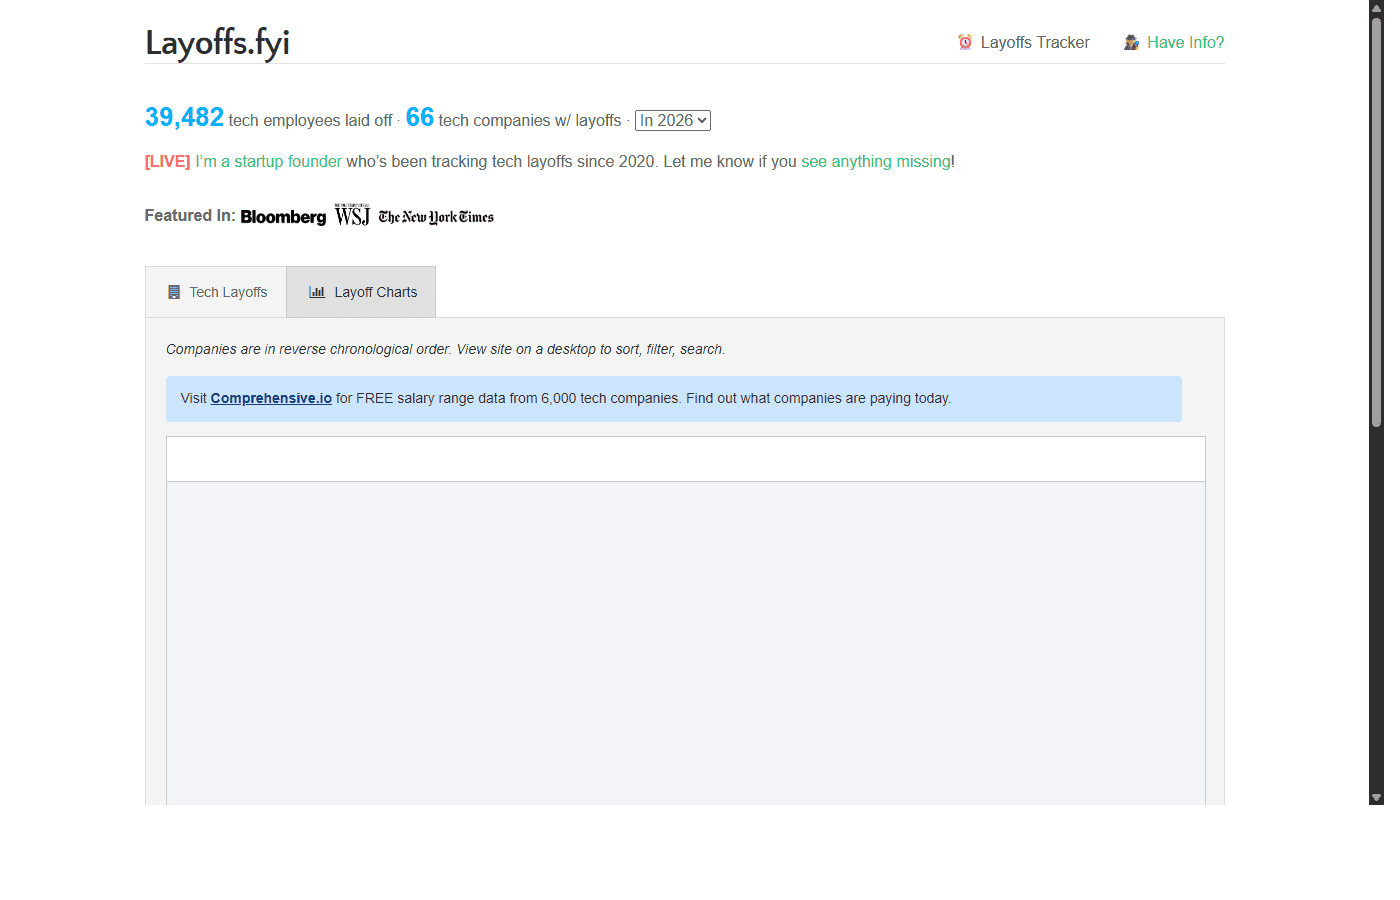
The scale of data is hard to ignore. In 2025 alone, 264,320 laid-off employees across 1,193 companies were recorded, and in 2026 (as of March) it’s already 39,482 people at 66 companies. Since 2020, the tracker covers hundreds of thousands of lost positions.
The interface is simple and doesn’t pretend to be anything more than it is: a sortable table with company names, number of layoffs, dates, and sources. A separate “Layoff Charts” tab shows trend visualizations. Lee encourages submitting missing information through a dedicated form, so the database grows through crowdsourcing.
Layoffs.fyi doesn’t focus on AI specifically. It’s a broader tracker covering all causes of workforce reduction in the tech industry, but that’s exactly why it provides context that more specialized tools lack. It lets you answer the question of whether AI-motivated layoffs are a big share of the total, or just a blip against the backdrop of general sector restructuring.
What does this all mean?
Each of these three tools covers a different piece of the puzzle. JobLoss.ai isolates only AI-linked layoffs, which gives a precise but narrow picture. Karpathy Jobs looks prospectively at occupations’ exposure to AI automation but doesn’t measure actual layoffs. Layoffs.fyi covers the entire tech market without distinguishing causes.
None of them is perfect. JobLoss.ai relies on media reports, and those don’t always tell the full story. Karpathy’s scoring is an LLM estimate, not empirical analysis. Layoffs.fyi doesn’t separate AI-driven layoffs from those caused by other factors. But together they form something like an “observatory” of AI’s impact on the labor market, and I’d rather have imperfect data than no data at all.
Karpathy’s repository has over 700 stars on GitHub. Layoffs.fyi has been cited by Bloomberg, WSJ, and the New York Times. People want numbers, not more think pieces. And these numbers are finally starting to show up.
DISCOVER ELEMENT!
Maciej Michalewski
CEO @ Element. Recruitment Automation Software
Recent posts:

Anthropic believes it is creating a higher being. The dispute over Claude’s constitution
Anthropic teaches Claude that it may refuse even its own maker. I go through the All-In Podcast debate and the warning from Mustafa Suleyman of Microsoft AI.
Job offers in Poland, September 2026: growth without industry
In September 2026, employers in Poland posted 269,436 job ads, 2% more than a year earlier. Healthcare grows, and manual work is the only industry in decline.

The Automated Company, part 1: why we are building a company run by AI
Part 1 of The Automated Company series: why Element hands routine work to automation and where people still make the decisions.

Element races ahead: Slack, default filters and global template updates
We had barely refreshed Element’s look when a Slack integration, default filters, global message template updates and adding candidates straight from a CV arrived.

Element’s new look: another job done well by AI agents under human supervision
Element has a new look: Material 3 on top of a frontend rewritten from Angular 13 to 18, with 181 of 182 code changes made by AI agents under human supervision.
Job offers in Poland, August 2026: more ads, fewer jobs
Poland posted 257,046 new job ads in August 2026, up 4% year over year, even as employment in the enterprise sector fell. Data from the Grant Thornton report and my take.